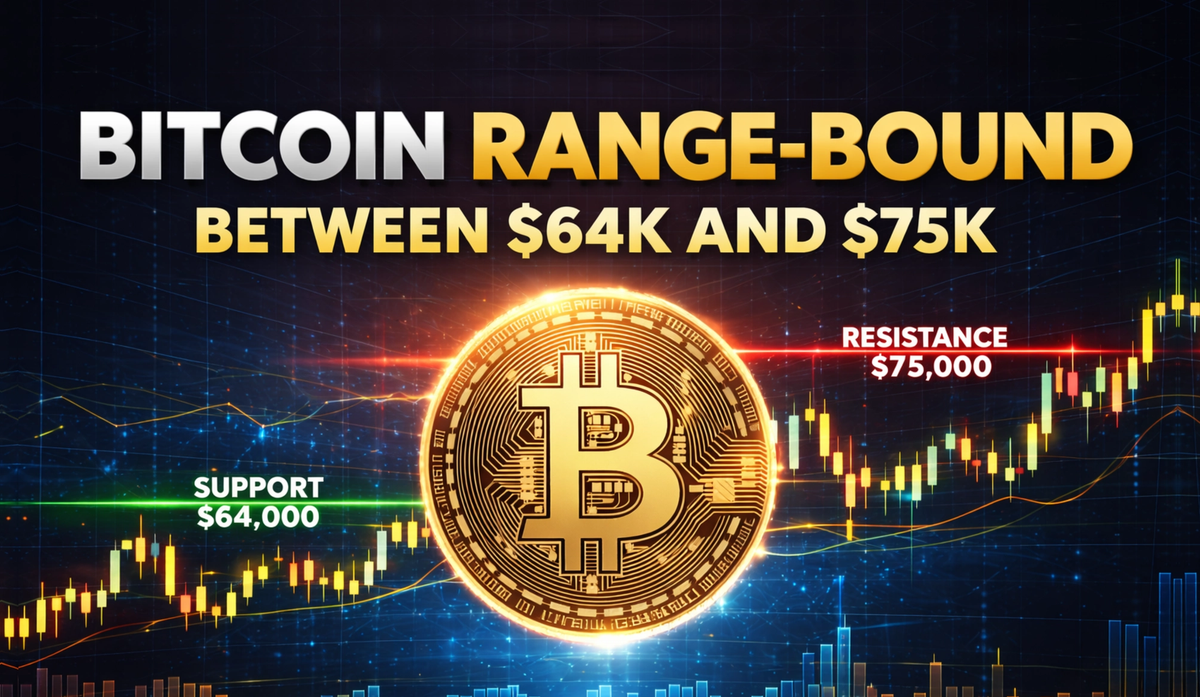
Bitcoin has been trading in a tight range between $64,000 and $75,000 since early February, with no sustained breakout in either direction. The consolidation follows a strong rally earlier in the cycle that pushed BTC to an all-time high of $126,198 on October 6, 2025, a level it has not come close to reclaiming since.
Since the start of April, momentum has shifted toward the upper end of that range. Bitcoin climbed to just shy of $76,000 on April 14, its highest level since before the February 5 crash, which sent prices briefly down to $60,000. The move was driven in part by optimism about ceasefire developments in the Middle East conflict, which weighed on oil prices and broadly supported risk assets. As of April 15, BTC is trading around $74,000, testing the same resistance zone it has approached multiple times this year without a confirmed breakout.
Macro conditions, particularly the ongoing U.S.–Iran conflict, have had a direct and measurable influence on Bitcoin's price this year. But macro alone does not explain the full picture. Beneath the surface, structural factors, including post-halving supply dynamics and persistent institutional buying through ETFs, have been quietly building a case for recovery.
Whether that case plays out in the near term or is delayed further depends on how Bitcoin behaves at current levels, and on conditions that extend beyond any single technical setup.

Why Bitcoin Price Is Struggling to Break the $72K–$75K Resistance
The $72,000–$75,000 zone has acted as a persistent resistance area. Each attempt to break above $72,000 has been met with rejection, indicating an active area of selling pressure. This behavior could suggest that traders and institutions who bought near those levels on the way down exit as the price returns to their entry point.
The macro backdrop has made that resistance harder to break. Fed Chair Jerome Powell signaled that interest rate cuts are likely off the table for the rest of 2026. Bitcoin declined 5% following that announcement, and the global crypto market cap fell 4.4% to $2.5 trillion. When borrowing costs remain elevated, capital tends to stay out of riskier assets, and Bitcoin, regardless of how institutional it has become, is still treated as a risk asset during periods of monetary tightening.
Geopolitics added further pressure. The U.S.–Iran conflict has kept oil prices above $100 since early March, pushing the Fed to raise its 2026 inflation forecast to 2.7% and effectively killing expectations for near-term rate cuts. Higher oil means stickier inflation, which means the Fed stays cautious, which means liquidity stays tight. That chain of events has acted as a ceiling on Bitcoin's recovery attempts every time geopolitical tensions flare.
The Fear and Greed Index remained in extreme fear territory for 46 consecutive days before the recent price uptick. That kind of sustained negative sentiment discourages new buyers from stepping in aggressively, even when the price is technically attractive. The result is a market that drifts sideways rather than building momentum.
The downside risk is real, but not the base case. If Bitcoin loses the $64,000 support level convincingly, analysts point to $60,000 as the next meaningful floor. Below that, the scenarios get more severe, but they require a macro deterioration or a significant institutional withdrawal that the data does not currently support.
What Could Push Bitcoin Price Back to $85K–$95K Range
The case for recovery rests on two things coming together: structural factors that have been quietly building throughout the downturn, and a macro environment that no longer actively works against them.
ETF Demand and Institutional Accumulation
Spot Bitcoin ETFs attracted $18.7 billion in net inflows in Q1 2026 alone, pushing total assets under management past $128 billion. That demand continued through the February crash and the geopolitical shocks of March, a sign that the institutional base buying into ETFs is not reacting to short-term price moves the way retail traders typically do.
Strategy, formerly MicroStrategy, purchased 89,618 BTC in Q1 2026 alone, its second-largest quarterly purchase on record. Corporate accumulation at that scale removes liquidity from the market and signals a conviction that the current price range is undervalued relative to where these buyers expect BTC to be.
Post-Halving Supply Squeeze
Meanwhile, the April 2024 halving cut the daily supply of new Bitcoin in half, and ETF demand has been absorbing more than double what miners produce each day. When demand consistently outpaces supply over an extended period, price eventually reflects that imbalance; the timing just rarely lines up neatly with expectations.
The halving cycle provides the clearest historical framework for timing. Previous halvings marked the transition point from post-bottom recovery into a full bull market phase, and projecting that pattern forward from the April 2024 halving places the potential peak window somewhere in 2026. That does not mean a new all-time high is coming; cycles can and do disappoint, but it does mean the current period sits squarely within the historical window where recoveries have begun.
Long-Term Holders Are Not Selling
Long-term holders with addresses that have held Bitcoin for 155 days or more currently control over 78% of the circulating supply, one of the highest readings in Bitcoin's history. That level of conviction among experienced holders limits the available liquidity on exchanges, reducing the selling pressure that could cap any demand-driven price move.
The MVRV (Market Value to Realized Value) ratio has held below 2.0 throughout early 2026, indicating the market remains well below the euphoria zone that has historically preceded major tops. In plain terms, the on-chain data does not indicate an overheated or rolling-over market; it shows a market waiting.
Bitcoin Price Outlook as BTC Tests Key Resistance Near $75K
The path back to $85,000–$95,000 is not complicated technically, but it is not guaranteed either. Bitcoin needs to close decisively above $75,000, reclaim the $80,000 level that served as a major turning point during the November selloff, and then challenge the 200-day moving average, which sits right in the middle of that target range.
Each of those steps requires follow-through buying, not just brief spikes. Right now, institutional demand is being absorbed steadily, but it is not yet driving a breakout; it is anchoring the price, not driving it higher.
A confirmed breakout above $75,000 or a breakdown below $64,000 is likely to define Bitcoin’s direction in the coming weeks.